October 8, 2024 by
David Goldberg - A&S News
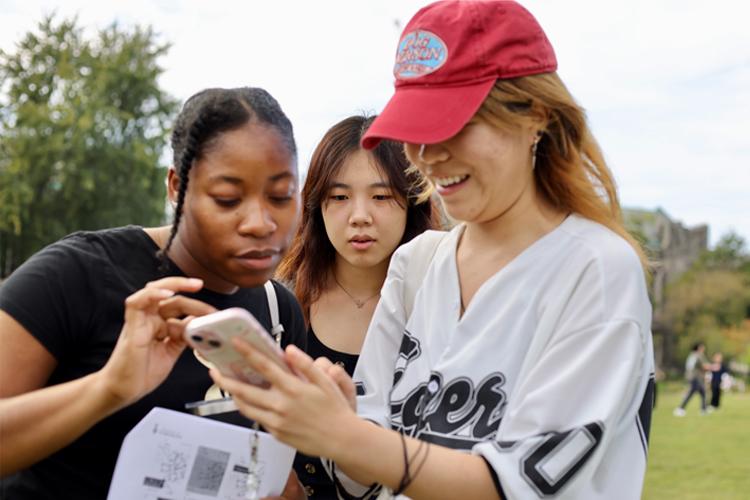
On a warm September afternoon, Arts & Science students walked across St. George Campus with thermometers as part of an experiential learning project mapped out by Assistant Professor, Teaching Stream Caitlin Cunningham.
“This was a little bit of a wild idea, but the department really let me run with it,” says Cunningham, a new faculty member who teaches GGR373 Advanced GIS in the Department of Geography & Planning.
GIS, or geographic information systems, combines maps with data and provides tools that make it possible to study everything from urban development to climate change and how location impacts those trends.
“What I love about GIS is that there is no end to the number of questions you can ask,” says Cunningham. “Once you answer one question, the results give you 50 more questions.”
The question for Cunningham’s class: Is there a relationship between vegetation cover and air temperature on campus? To answer it, her students compared data collected from standard household thermometers so they could compare it with satellite data.
The world's first ever GIS was developed in Canada in the early 1960s to map and manage the country’s natural resources. Today, GIS draws from thousands of sources worldwide including LANDSAT, a series of NASA satellites that record data about temperature, pollution, rainfall and, most importantly for Cunningham’s students, vegetation cover.
The experiment begins
Equipped with thermometers bought through the faculty’s Pedagogical Innovation and Experimentation Fund, students fanned out across campus in small groups. Using a smartphone app, they navigated to their sample points (about 100 between them), recorded their temperature readings and uploaded the data in real-time.
Oliver Siebertz, a fourth-year urban studies major, says the project helped him hone skills he’ll need in the future.

“I worked at Metrolinx last summer, and this GIS work is pretty similar to what I did, mapping fare machines and other transit infrastructure,” said Siebertz, a member of Innis College.
Although some students had prior experience with GIS, Cunningham is teaching them how to plan, execute and analyze a real-world project.
“Students in GIS courses spend a lot of time in computer labs looking at spatial data on a screen, but Professor Cunningham’s approach is to make sure her class knows those data sets come from somewhere and that’s so important,” says Michael Widener, department chair and professor.
The experience taught fourth-year Lily Deng, a human geography specialist with a minor in political science and GIS, that collecting live data is challenging.
“The temperature was changing a little bit with the clouds moving in and out, so I feel like that could sway the readings,” says Deng, a member of University College. “I was grateful for the experience.”

Another obstacle was reading the thermometers; the mercury measured in increments of two, which led to variability in the readings, but Cunningham seized the learning opportunity.
“Data isn’t always perfect, and we have to think about some of these issues with any data set,” she said. “It doesn’t mean that what you collected was wrong, only that you have to keep your limitations in mind.”
Back in the classroom, students discovered — in most cases — a noticeable difference between shaded areas and exposed urban spaces. For example, the temperature on the wide-open Front Campus was several degrees warmer than the leafier grounds of Queen’s Park.
Cunningham is pleased with the results but already has ideas for improving the experiment. She was impressed by how fast students recorded the temperatures and says next year she will get them to collect even more data.


